
Numbers Rule the Room
When a CEO steps into the boardroom, it’s not vision statements or brand stories that dominate the conversation — it’s numbers. Boards expect CEOs to know their company’s financial health like a surgeon knows anatomy: precisely, instinctively, and with the ability to act fast when something’s off.
Whether you run a public company, a venture-backed startup, or a privately held enterprise, mastering the right financial Key Performance Indicators (KPIs) isn’t optional — it’s survival. Below are the financial metrics that command the board’s attention and shape how directors judge leadership, performance, and strategy.
1. Revenue Growth Rate
Why it matters:
Revenue growth is the most direct measure of a company’s ability to expand its market presence. Boards look for consistent, sustainable growth rather than erratic spikes driven by one-time wins.
How it’s calculated:

What the board wants to know:
-
Are we gaining or losing market share?
-
Is growth organic (new customers, higher sales) or inorganic (acquisitions)?
-
Is revenue concentration risky — too dependent on one product, client, or region?
A CEO who can tell this story — the why behind the growth — builds credibility instantly.
2. Gross Margin
Why it matters:
Revenue means nothing if profitability evaporates at the top line. Gross margin reveals how efficiently the company produces and delivers its goods or services.
How it’s calculated:

What the board wants to know:
-
Are we pricing correctly?
-
Are production costs under control?
-
How do our margins compare with competitors?
Gross margin trends are often the first clue to operational inefficiency or a brewing pricing problem.
3. EBITDA and EBITDA Margin
Why it matters:
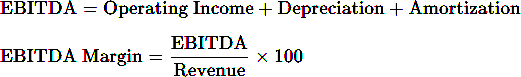
EBITDA — Earnings Before Interest, Taxes, Depreciation, and Amortization — strips away the noise of accounting decisions and financing structures. It’s a clean look at operating performance and cash generation.
How they're calculated:
What the board wants to know:
-
Are we improving our operational efficiency?
-
Is growth translating into profitability?
-
How resilient is the business if market conditions tighten?
EBITDA margin is often the go-to comparison tool across divisions or with peers.
4. Operating Cash Flow (OCF)
Why it matters:
Cash is oxygen. Many companies look profitable on paper but struggle to stay liquid. Operating cash flow tells the board how well the company’s core business actually generates cash.
How it’s calculated:
![]()
What the board wants to know:
-
Are we funding growth from operations or burning cash?
-
How predictable is our cash cycle?
-
Can we weather a short-term downturn without external financing?
A CEO who tracks cash conversion cycles (how quickly cash invested turns back into cash collected) can anticipate liquidity issues before they hit.
5. Net Profit Margin
Why it matters:
This is the bottom line — literally. Net profit margin shows what percentage of each dollar earned ends up as profit after every expense, tax, and interest payment.
How it’s calculated:
![]()
What the board wants to know:
-
Are we scaling efficiently?
-
Is our cost structure sustainable?
-
Are our strategic bets (R&D, marketing, expansion) paying off?
Boards scrutinize net profit trends closely. A declining margin can signal competitive pressure, cost creep, or poor capital allocation.
6. Return on Invested Capital (ROIC)
Why it matters:
ROIC measures how effectively a company turns invested money — from both debt and equity — into profit. It’s a test of strategic discipline and capital efficiency.
How it’s calculated:

What the board wants to know:
-
Are we creating or destroying shareholder value?
-
Could that capital be better deployed elsewhere?
-
Are new projects clearing our cost of capital?
A CEO who talks fluently about ROIC demonstrates they understand the company’s engine for long-term value creation.
7. Debt-to-Equity Ratio
Why it matters:
Leverage is a double-edged sword. It can amplify returns — or risk. Boards watch this metric to ensure the company isn’t overexposed to interest rate shocks or liquidity stress.
How it’s calculated:

What the board wants to know:
-
Is our capital structure balanced?
-
Can we service our debt under multiple scenarios?
-
Are we borrowing strategically or out of necessity?
The CEO should be ready to explain how debt supports growth rather than burdens it.
8. Free Cash Flow (FCF)
Why it matters:
Free Cash Flow is what’s left after the business has reinvested to sustain operations and growth. It’s the money available for dividends, debt repayment, or strategic acquisitions.
How it’s calculated:
![]()
What the board wants to know:
-
Do we have enough flexibility to fund innovation or buybacks?
-
How stable is our cash generation?
-
What’s our return on those reinvestments?
Free cash flow is often the single most telling indicator of long-term financial health.
9. Current Ratio and Quick Ratio
Why it matters:
Liquidity ratios show whether the company can meet its short-term obligations without panic.
How they’re calculated:

What the board wants to know:
-
Are we managing working capital efficiently?
-
Are we sitting on too much idle cash or stretching payables dangerously?
These ratios are especially important in industries with volatile cash cycles.
10. Earnings Per Share (EPS) and EPS Growth
Why it matters:
EPS is a shorthand measure of profitability for shareholders. It drives stock valuation and investor sentiment.
How it’s calculated:

What the board wants to know:
-
Are we creating consistent shareholder returns?
-
Is EPS growth driven by real performance or financial engineering (buybacks, accounting)?
A CEO who can discuss EPS in the context of long-term strategy — not just quarterly optics — wins the board’s confidence.
11. Total Shareholder Return (TSR)
Why it matters:
For public companies, TSR is the ultimate scoreboard. It captures the combined effect of stock price appreciation and dividends.
How it’s calculated:

What the board wants to know:
-
Are we outperforming our peers and the market?
-
Is management execution translating into real investor value?
Boards see TSR as a reflection of leadership credibility in the capital markets.
12. Burn Rate (for Startups)
Why it matters:
For early-stage or venture-backed companies, burn rate — the rate at which cash reserves are being spent — is the oxygen gauge.
How it’s calculated:

What the board wants to know:
-
How many months of runway do we have?
-
Is spending aligned with growth milestones?
-
When will we reach breakeven or need another round?
CEOs who manage burn with discipline send a clear signal that they can scale responsibly.

How the Best CEOs Use These KPIs
Top-performing CEOs don’t just report numbers; they interpret them. They connect financial performance to strategic choices — pricing, hiring, product mix, capital allocation, and risk management.
Boards don’t expect perfection, but they do expect mastery: a clear grasp of what’s driving the numbers and a credible plan for improving them.
Here’s what separates the best from the rest:
-
Context, not just data. Numbers without narrative don’t persuade.
-
Forward-looking insight. Great CEOs forecast — they don’t just summarize.
-
Simplicity. They can explain complex financials in plain language that anchors strategic discussions.
The boardroom isn’t a math test; it’s a strategy forum powered by numbers.
FAQ: Financial KPIs and the CEO’s Role
Q1: How many KPIs should a CEO track regularly?
A focused dashboard with 10–15 well-chosen KPIs is ideal. Too many metrics dilute attention; too few risk missing warning signs.
Q2: Should financial KPIs differ across industries?
Yes. Core indicators like revenue growth and cash flow are universal, but industry-specific metrics (like same-store sales in retail or churn rate in SaaS) give better insight into performance drivers.
Q3: How often should these KPIs be reviewed with the board?
Typically quarterly, but smart CEOs track them weekly or monthly internally. The more real-time your visibility, the better your ability to act.
Q4: What’s the best way to present KPIs to the board?
Tell a story: highlight trends, root causes, and planned actions. Use visuals like dashboards or year-over-year comparisons. Avoid drowning the board in raw data — show what matters.
Q5: How can CEOs align teams around these KPIs?
Translate company-level KPIs into team-level goals. For instance, if the company targets a higher gross margin, product and operations teams should have initiatives directly tied to cost efficiency or pricing power.
Bottom Line:
Boards don’t want a CEO who memorizes numbers — they want one who owns them. Mastering these KPIs isn’t just financial hygiene; it’s leadership currency.
When the numbers rule the room, make sure they speak your language.
Need help mastering these numbers? Preferred CFO can help! Check out our outsourced CFO services and talk with us!

The Add-On Business Model and Why it Rocks

How to Create a 12-Month Forecast Without a 2026 Budget

No Comments Yet
Let us know what you think